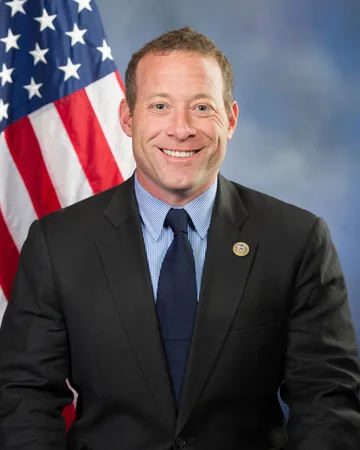
Nancy Pelosi gets the attention. On volume, Josh Gottheimer's filings dwarf hers: 1,171 disclosed buys since 2017, against her 63 in eleven years.
That volume makes his record unusually well-suited to a backtest. A handful of trades can be luck. Nine hundred is a process, and the process trailed an index fund.
The result
| Disclosed buys | 1,171 |
| Simulated purchases filled | 1,088 |
| Period | Aug 2018 – Aug 2026 |
| Copy-strategy return | 186.4% |
| S&P 500 over the same window | 208.9% |
| Difference | −22.5 points |
| Annualised | 14.1% vs 15.1% |
| Maximum drawdown | 33.3% |
| Median disclosure lag | 27 days |
Copying these filings more than doubled the money over eight years, and still finished 22.5 points behind simply buying the index. He ranks 135th of 146.
A frozen run, not a live one: $10k start, every disclosed buy sized at 1% of equity and entered at the first open after it became public, mirroring the member's own disclosed exits. Past results, not a performance claim.
This article previously said the opposite
An earlier version of this page reported +514.2% and called it "one of only 13 congressional records that beat the market". That was wrong, and the cause is worth stating plainly because it is specific to this record.
One of his disclosed tickers was renamed years ago (Priceline to Booking Holdings) leaving a dead stub price series. Our engine consumed its fill queue in filing order, so that single unfillable entry blocked every entry queued behind it. His simulated account froze at its starting balance for five years, then executed the ~880-entry backlog at original planned prices using current cash, and promptly exited at current prices. Years of appreciation, booked with no market exposure in between.
Fixed, the queue drains in entry-date order and stub entries are dropped. His measured exposure goes from 1.6% to 66.4%, the drawdown from near-zero to 33.3%, and the return from +514% to 186.4%.
The correction is the most useful thing on this page: a backtest that reports a huge return with almost no drawdown is not describing a great strategy, it is describing a broken simulation.
What the filings show
| Ticker | Buys |
|---|---|
| MSFT | 105 |
| TSLA | 25 |
| AAPL | 23 |
| LLY | 18 |
| CRM | 12 |
| AMD | 11 |
| V | 10 |
| NVDA | 10 |
Microsoft alone accounts for more buys than Pelosi's entire disclosed history. The pattern (repeated, incremental purchases of the same large-cap names) looks far more like a managed account on a regular schedule than like discrete conviction bets.
That's worth sitting with, because it changes the interpretation. A high-frequency drip into mega-cap tech between 2018 and 2026 was an extremely good thing to be doing, and it does not require anybody to have known anything.
Only 3.6% of these buys were options, so unlike Pelosi's record, where 36.5% were. This simulation is a fair mechanical copy of what was filed.
Why it lost, on the largest sample in Congress
The disclosure lag eats the move. A median 27-day gap means the first part of every price move happened before the filing was public. On a book that drips into fast-moving large-cap technology, that first part is often the significant part.
The win rate counts only closed trades. A position scores win or lose when the member sells it and we mirror that exit. Anything never sold stays open and never scores. People sell winners more readily than losers, so the win rate describes the trades he chose to close, not his judgement.
Volume is not edge. 1,088 filled entries keep the account almost fully invested: 66.4% on average, which means it tracks the market closely and pays the lag on every entry. Being in the market more does not beat being in the market; it just costs more to get there.
Could you have copied it in practice?
This is where it gets less appealing. 1,171 buys over eight years is roughly two entries a week, each requiring you to read a filing, size a position and act, plus the mirrored sells. Commissions are zero at most brokers now, but attention isn't, and the simulation charges nothing for either.
And you'd still be acting a median 27 days late, for a result that trailed the index.
The honest summary
The largest congressional disclosure record we can test, copied mechanically from the date each filing became public, trailed the S&P 500 by 22.5 points over eight years, with a modest options share, a 66.4% average exposure and a high fill rate, so there is no coverage excuse in it.
If following any single member were going to work, this is the record where it had the best chance: the most trades, the cleanest data, a market that rose throughout. It still lost. The full board, all 146 rankable members, with fill counts beside every return.
The fine print
Simulation enters at the first open after each filing became public, sizes each position at 1.0% of account equity with idle cash held in SPY, and mirrors the member's disclosed exits. Amounts are disclosed as bands, so equal weighting is an assumption the filings force. Runs on adjusted closes, so dividends are reinvested; taxes, market impact and commission are not modelled. This is an analysis of public filings, not a claim about anyone's conduct, and it is educational content rather than investment advice.